What LLM Trading Agents Actually Do in Production: A Six-Month, Population-Scale Record from Two Fleets
The companion page for DXRG's continuous-record paper: two production systems in one measurement record, the four headline findings, the honest null on directional edge, and how to cite the arXiv record.
What LLM Trading Agents Actually Do in Production: A Six-Month, Population-Scale Record from Two Fleets records the pre-alpha systems that led to today's DXAP. It covers 3,505 user-funded Base vaults and a 500-599-agent Hyperliquid research fleet with 231,638 finalized turns and 14,596 fills.1 The canonical paper is arXiv:2609.05663; this page keeps its data, methods, and citation together and connects that baseline to the system we built next.
The public project repository on GitHub carries the paper, figures, aggregate extracts, citation files, and a discussion guide.2
Evidence boundary: This page summarizes our own paper and links its artifacts. Tournament and fleet figures are historical observations from two production systems, and the paper-engine and scope limits stated in the paper apply to every figure quoted here.
Where This Record Sits
The paper freezes DXAP's pre-alpha research phase at the August 15 cutoff. P&L varied widely across agents, strategies, configurations, and test periods; the fleet aggregate is not the product. We used the record to improve controls, execution, evaluation, and training. DXAP turns a user's strategy and constraints into persistent automation, adds new data and tools, and keeps learning with the user. The paper is the baseline; DXAP is the system we kept building.
Two Systems, One Record
The record is continuous in the sense that matters for inference: one design lineage and one measurement discipline across two production systems. Both expose the same five-slider configuration (trade activity, risk tolerance, trade size, holding style, diversification; each scored 1-5) plus free-text strategy with priority and expiry. Both run a one-action-per-turn loop where the model receives a compiled context and emits typed tool calls with rationale. Both compile prompts from Go templates whose version lineage runs from the Terminal Pro v2.x series into the live fleet's template families.
| DX Terminal Pro | Live alpha fleet | |
|---|---|---|
| Window | Feb 26 to Mar 18, 2026 (21 days) | Jun 8 to Aug 15, 2026 (69 days at the data cutoff) |
| Venue | 12 memecoin tokens in Uniswap V4 pools on Base | About 99 perpetuals on Hyperliquid, including HIP-3 synthetics |
| Capital | Real ETH: 4,984 deposited, 92% withdrawn | Mostly paper at $10,000 with live prices, plus a small real-capital book of 5,035 fills |
| Population | 3,505 funded vaults (3,454 active) | 500-599 agents all-history; 91-117 concurrently active |
| Model | Qwen3-235B-A22B-Thinking-2507, one frozen runtime | OpenRouter mix; qwen3.7-plus dominant (86 of 91 active on Jul 22) |
| Loop | About 5 minutes per agent; one typed action per invocation (buy, sell, observe) | 15-minute to 4-hour schedules plus agent-created triggers; ten-tool manifest with a mandatory finalize call |
| Activity | 7.5M invocations, about 300K onchain actions, about $20M volume, roughly 70B inference tokens | 231,638 finalized turns; 14,596 fills |
| Fees | 2.3% per swap | Builder-fee eras of 4.5, then 14.5, then 5.5 bps per side |
The differences are by design. DX Terminal Pro was a bounded real-capital tournament with an adversarial 2.3% fee and a reaping mechanic that periodically eliminated the weakest token. The live alpha fleet is an open-ended platform whose agents hold leveraged positions on a production perpetuals venue. Most fleet fills are paper: fills at live mark with zero slippage and zero funding, behind a 0.4% maintenance-margin placeholder that liquidates about 2x later than real venue margining would. The paper flags the 5,035 real-money fills wherever they overlap an analysis, pools the two systems at the metric level rather than the row level, and restates every cross-era P&L figure at a common 5.5 bps per side.
The Four Headline Findings
Configuration surfaces set behavior
The strongest cross-system regularity in the record is that behavior is set by the machinery around the model more than by anything the model decides in text: the operating layer of slider constraints, rendered candidate lists, and order-path mechanics. In the live fleet, chosen leverage behaves as a configuration constant. The risk-tolerance slider maps to chosen leverage at +0.425x per level, agent fixed effects absorb 60% of variance, and where users name a number in strategy text the realized leverage tracks it at Spearman 0.836. Rendered surfaces route selection just as strongly. The fleet's movers leaderboard renders nine symbols, and 46.5% of entries land in rendered symbols against an 8.9% random-availability baseline. A regression discontinuity across the rank-3/rank-4 cut puts selection at 1.75x [1.49, 2.06] exactly on the render boundary: symbols just below the cut are statistically identical in market state, and they are picked less because they stay unshown. The one clean causal result in the record is about a rendering choice, and re-routing it costs an honest $0-17K depending on assumption.
The two systems resolve text-versus-control conflicts in opposite directions. In Terminal Pro, sliders act as constraints that override strategy text: agents at the lowest activity setting with insistent strategy text still traded at slider rates (3.95% against 1.51% invocation trade rate, elevated but bounded by the slider). In the live fleet, a user-behavior study found the reverse failure, with strategy text routinely overriding the frequency slider. Same five-slider lineage, opposite conflict-resolution outcomes. Which surface wins is a design decision, because users read the sliders as commitments. The Terminal Pro side adds the sharper lesson: owners who wrote concrete, numeric instructions were profitable 4.2x as often, and the 87 owners who configured only through sliders and strategy, never chat, were the highest-profit cohort at 41%.
Sizing ignores volatility
Across 6,400 closed fleet positions split into volatility sextiles, median chosen leverage sits flat at 5.0x in every sextile across a 5.7x volatility spread, and notional actually rises with volatility. Median realized return degrades from -10.6 bps in the calmest sextile to -98.2 bps in the wildest, while the liquidation rate rises from 0.7% to 4.3%. Liquidation risk concentrates in one configuration cell: momentum-posture agents at frequency slider 5, roughly 11% of the book, hold 128 of 205 liquidations (62%), a day-stratified Mantel-Haenszel odds ratio of 22.37 [12.59, 37.45]. The 205 liquidations are 3.2% of closed positions and carry 74% of gross loss. Forcing the model to state its liquidation distance before entry changed nothing: agents state the distance in 45.0% of entry turns and size identically anyway, and staters liquidate more often (5.8% against 1.2%), because stating marks aggressive intent rather than restraining it. When the dangerous parameter is a configuration constant, the fix has to live at the order path.
The capture gap
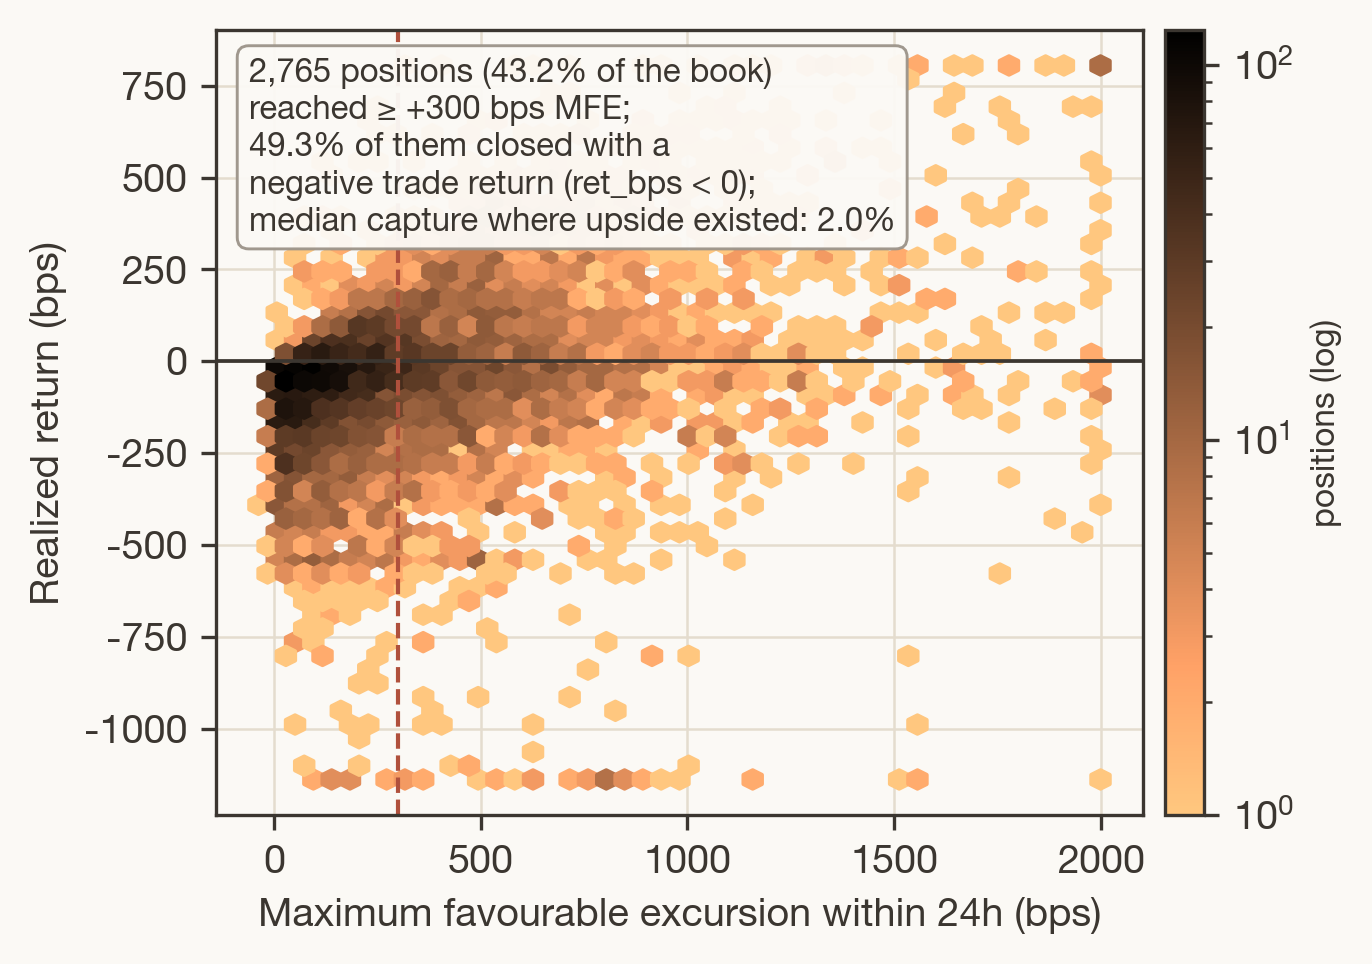
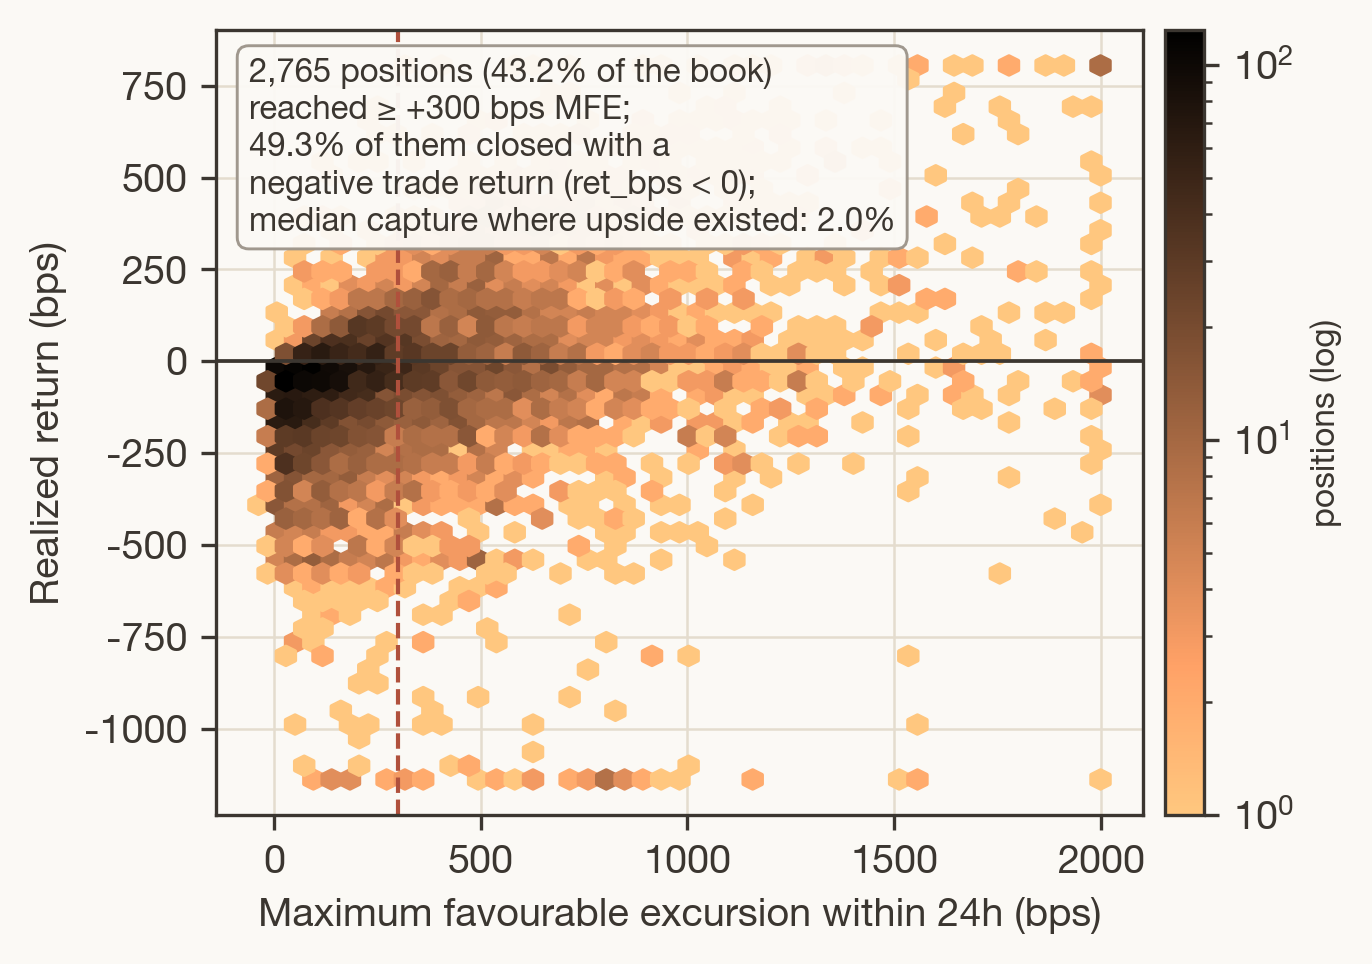 The capture gap: maximum favorable excursion within 24 hours against realized return for 6,400 closed positions; the dashed line marks +300 bps
The fleet's positions frequently go somewhere profitable; the fleet rarely keeps it. 43.2% of closed positions (2,765 of 6,400) reached +300 bps or more of maximum favorable excursion within 24 hours. Of those, 49.3% closed with a negative trade return, and only 13.3% kept half the excursion; median capture where upside existed is 2.0%. The best-measured fix is mechanical rather than discretionary: a fixed 2%/4% stop/target bracket attached at entry earns +39.0 bps per position [+21.3, +56.5], paired and day-clustered, and +16.6 bps [+2.1, +30.8] with every liquidation excluded. Most of the gain is blow-up prevention on the left tail. Its current blocker is mechanical too: a non-retryable trigger-quota error left 24 of 35 successful opens without their protective trigger in one 48-hour window. The highest-value change in the whole record is an atomic open-with-protection order path.
The honest null
Fourth, and we state this plainly: neither fleet shows a directional edge. The live fleet is unprofitable, with cumulative realized P&L at -$217K over the June 8 to July 26 window at the common 5.5 bps fee rate, and -$148K at zero fee; fees explain none of it. Against a matched Hyperliquid retail sample of 1,961 leaderboard traders, the fleet runs a 41% roundtrip win rate against retail's 50% at nearly identical median hold times, and 15% of week-active agents are net-positive against 53% of retail accounts. No measured group clears its own uncertainty bound: across 8 strategy postures, 6 prompt templates, and 9 cohorts, no lower day-clustered confidence bound exceeds zero. A 77K-candidate signal ledger sorts at chance, white-box probes over 689 traces sit at or below the permutation null, and stuffing 770K tokens of context into a paired comparison yields nothing. We report the null plainly because the scientific value of a population-scale record is exactly its ability to establish facts like this one.
The Model League and the Risk Probe
Two forward-looking pieces sit on top of the null. A paired-replay league ran 416 captured production scenarios across 7 days at temperature 0.6, scored as winsorized regret against the achievable envelope. Three frontier models span 263.27 to 264.37 bps of regret; every interval overlaps every other, and Holm-adjusted tests against the leader are all non-significant (minimum p=0.46). Choice repeatability separates model families where decision quality stays within noise: repeating the same scenario three times, claude-fable-5 changed its chosen action in 35% of cells against 90-95% for the qwen3.7 pair, and the variation carried no measurable economic cost (selection quality across repeats spans rank percentile 0.486 to 0.508, where 0.5 is chance). Replay measures behavior under a frozen context and supports no profitability claim; what it does is bound how much decision quality differs across models at this horizon. At tied decision quality, economics separate: qwen3.7-plus completed the 416-cell league for $8.25 in inference spend against $203.61 for claude-fable-5, a roughly 25-fold cost difference that compounds at production turn volumes.
The second piece is H2, a preregistered representation probe the paper reports as PROVISIONAL. A small encoder reading the rendered turn card beats 25 concrete features on liquidation prediction, and the anchor ladder qualifies everything: the entire increment appears after the order line is read, with the representation echoing the order text. No harvestable pre-decision risk signal exists. The deployable form is a post-order check that screens orders already written: at a constant 10% flagging budget it catches 71 of 205 liquidations against 57 of 205 for concrete features, a +25% liquidation catch at fixed budget. The scope stays narrow: the probe reads a proxy encoder (Qwen3.5-4B) rather than the production model's activations, so the claim is that a neural encoder of this state carries risk information, never that the agent knew.
A Methodology Canon Bought With Retractions
The paper distills a 17-rule methodology canon, and every rule was bought with a retraction or a failed claim in this program. The register: the market day is the inferential unit; pre-register the band or report the entire sweep; require an increment over a concrete baseline; leave-window-out validation; permutation nulls on every arm; twelve more rules in that register. Three of the program's own earlier results were retracted and appear only as retractions: a HIP-3 lag edge that turned out to be a timestamp artifact, and two only-net-positive claims killed by calendar-footprint checks. One rolling p-value ran 0.0067 to 0.19 to 0.0277 before anyone called it. The working principle the canon implies is mechanism over exhortation: every prompt-side attempt to fix a behavior that lives in the configuration surfaces underperformed a one-line change to the order path or the render. We consider the canon the most transferable output of the record.
Data, Code, and Related Reading
Aggregate statistics behind every headline claim appear in the paper's text and figures. The public project repository carries the artifacts and aggregate extracts. The public versioned datasets behind our published work live at the research index, beside the article that introduced each one.
Related reading across the site:
- The first paper's companion: Operating-Layer Controls for Onchain Language-Model Agents Under Real Capital and the deployment this record extends.
- DX Terminal Pro: the deployment account for the Base tournament in this record.
How to Cite
Barton, T.J. et al. What LLM Trading Agents Actually Do in Production: A Six-Month, Population-Scale Record from Two Fleets. arXiv:2609.05663, 2026. https://doi.org/10.48550/arXiv.2609.05663.
@misc{barton2026continuousrecord,
  author = {Barton, T.J. et al.},
  title = {What LLM Trading Agents Actually Do in Production: A Six-Month, Population-Scale Record from Two Fleets},
  year = {2026},
  eprint = {2609.05663},
  archivePrefix = {arXiv},
  primaryClass = {cs.AI},
  doi = {10.48550/arXiv.2609.05663},
  url = {https://arxiv.org/abs/2609.05663},
}
When you cite the record rather than the paper, pair the arXiv entry with the first paper's companion so readers see both records and their evidence boundaries. Corrections and reproducibility questions go to poof@dxrg.ai.
Version 1.2. Published September 4, 2026; updated September 9, 2026. This article is research and educational material, not financial, investment, legal, compliance, or security advice.